Smart Site Protection™:
Smart Site Protection™ dashboard
SSP WEB DASHBOARD OVERVIEW
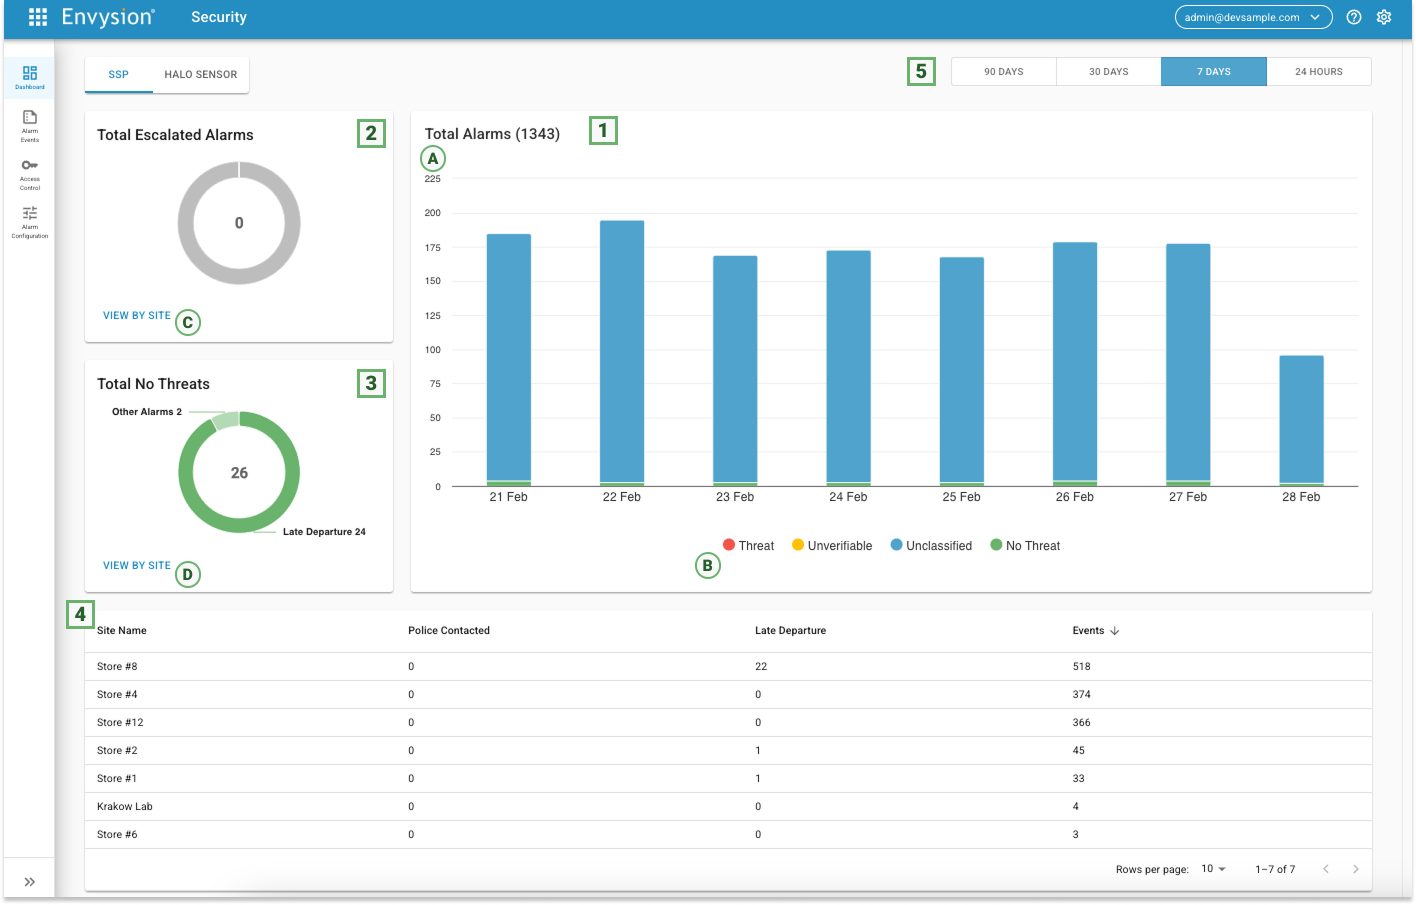
SSP dashboard presents all the events across all the locations the active user has access to. On the dashboard you will see:
1) Total Alarms Chart – On the Total Alarms Chart you can see the total number of Alarms detected over the set period of time (A). On the bottom of the chart, you can find the Verification Status filters (B). By Default all Verification statuses are selected, but you can filter them out by clicking on the corresponding status.
2) Total Escalated Alarms Card – On this card you can see the total number of events that were escalated to the dispatch agent, regardless of their verification status. This means that you can see here not only “Threats”, but also “Unclassified” or even “Unverifiable” events, if for any reason, they were escalated to the dispatch agent. The events are split into “Cancelled” Alarms (the escalated events that turned out to be false alarms and were canceled by the emergency contact person) and “Police Contacted” alarms (the escalated alarms that resulted in Emergency services being contacted and arrived on scene). On the bottom of the card you can see a “View by Site” button (C), that automatically sorts the table be
low by number of total dispatches alarms.
3) Total No Threats Card – On this card you can see the total number of “No threat” alarms and how many out of the total number were verified by a verification agent and categorized as a “No Threat” compared to the number of alarms that were automatically categorized as a “No Threat” because of Late Departures (if this feature is enabled). The alarms are displayed visually in a doughnut chart, and spit accordingly. On the bottom of the card you can see a “View by Site” button (D), that automatically sorts the table below by number of total “Late Departure” alarms.
4) The list of sites – The list of sites displays all sites that have triggered any alarm, and it is by default sorted by the total number of alarms detected. It can be sorted by any column, by clicking on the column header, or it can also be sorted from the two “Total Dispatched” and “Total No Threats” cards, as described on points 2 and 3 above. Each row of the table is clickable, and if clicked, will take you to the respective site’s “Alarm Summary” page, in a new tab in your browser. On the bottom of the table you can find the pagination functionalities. From here you can select how many results you want to see on one page (by default is 10) and you can navigate to the next or previous page.
5 Date range filter – On the top-right corner of the page you can find the date range filter. By default it is set to 7 days, but you can change it to 30 days, 90 days or the last 24 hours by clicking on any of these options. By changing the date range, all three cards on the Smart Site Protection™ dashboard will display filtered results.