Watch Video and Events:
Heatmaps
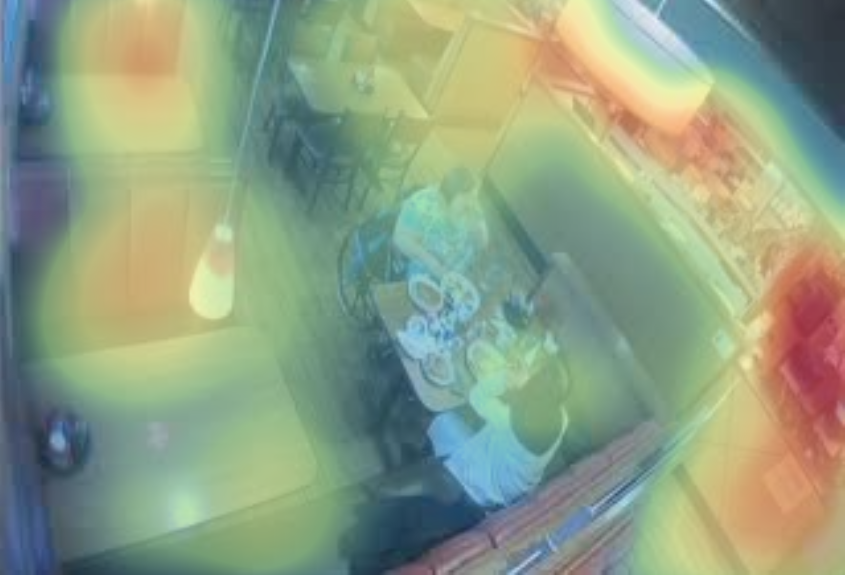
Motion-based heatmaps give an overview of motion in an area over a selected time period, with red indicating more activity, and blue indicating less activity.
To access your site’s heatmaps in the web app, follow the steps outlined below.
In your Home Workspace go to Sites and use the search bar to search for a specific location then click on that location.

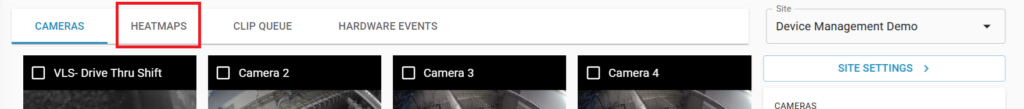
When you are in the proper Site page, then change the tab to Heatmaps.
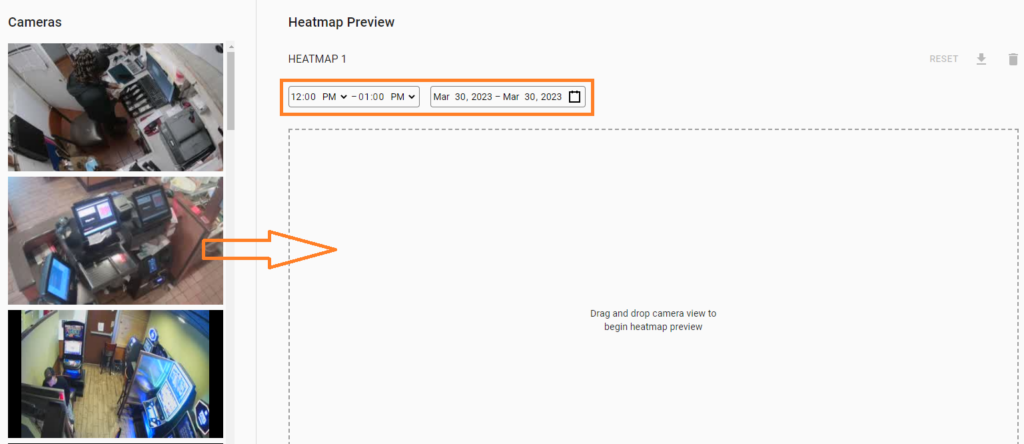
Cameras from the site are listed on the left. Drag and drop any camera to the Heatmap Preview to view the Heatmaps. By default, new heatmaps will be generated for yesterday, between 12-1pm.
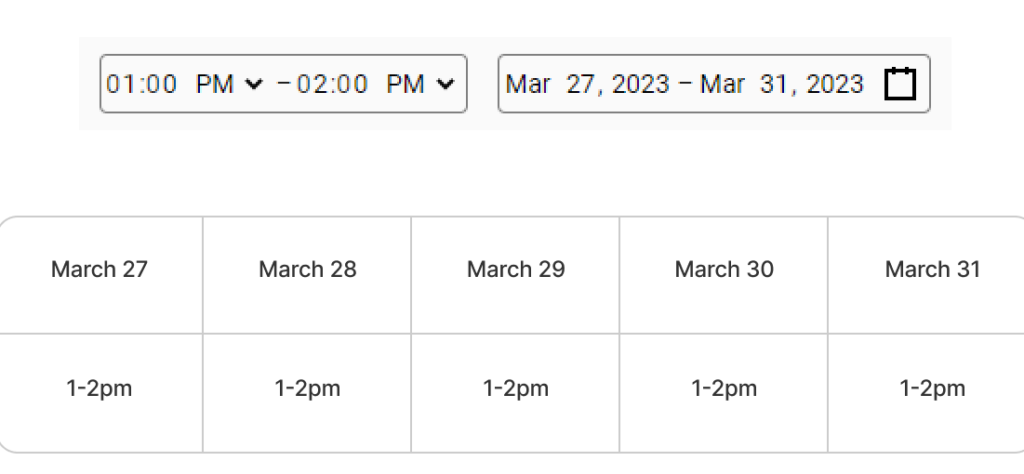
To change the time duration of the heatmap, use the time selectors to update the date and time to the desired duration. Motion activity is calculated for the time range on each date of the date range. For example, selecting 1-2pm for March 27 to March 31 generates a heatmap that gives an overview of the motion activity between 1-2pm on each day from March 27 to March 31, not for activity between 1pm March 27 until 2pm March 31. The heatmap will automatically adjust
Heatmaps can only be generated when there is motion data available. Heatmaps can only be generated from video available on the appliance. Heatmaps cannot be generated from restored Cloud Archive video.
To generate multiple heatmaps, select ![]() underneath the Heatmap Preview.
underneath the Heatmap Preview.
To download each heatmap, select ![]() to download the heatmap as an image.
to download the heatmap as an image.