Administrative User Setup:
Usage Dashboard
The Usage Dashboard provides visibility into your company’s usage of Envysion broken down into Domain Usage and Usage by User. Domain Usage provides metrics on the use of Envysion across all users in your domain. Usage by User provides both a table and exportable spreadsheet to show how each individual user engages with Envysion.
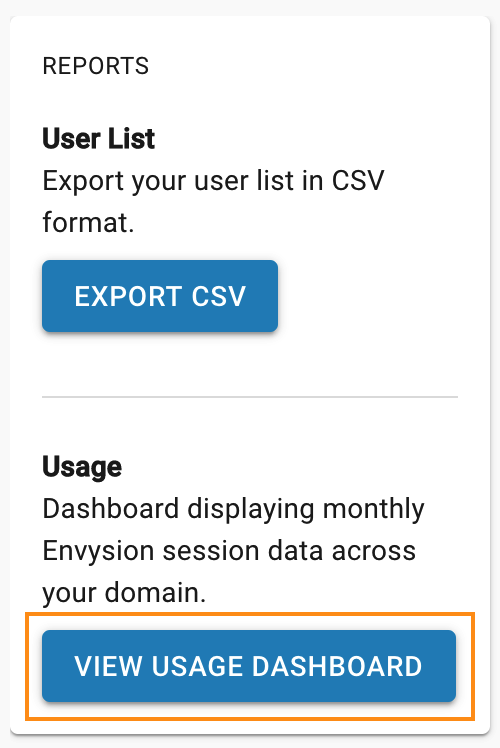
To access this page go to the Users page and select View Usage Dashboard from the left side menu.
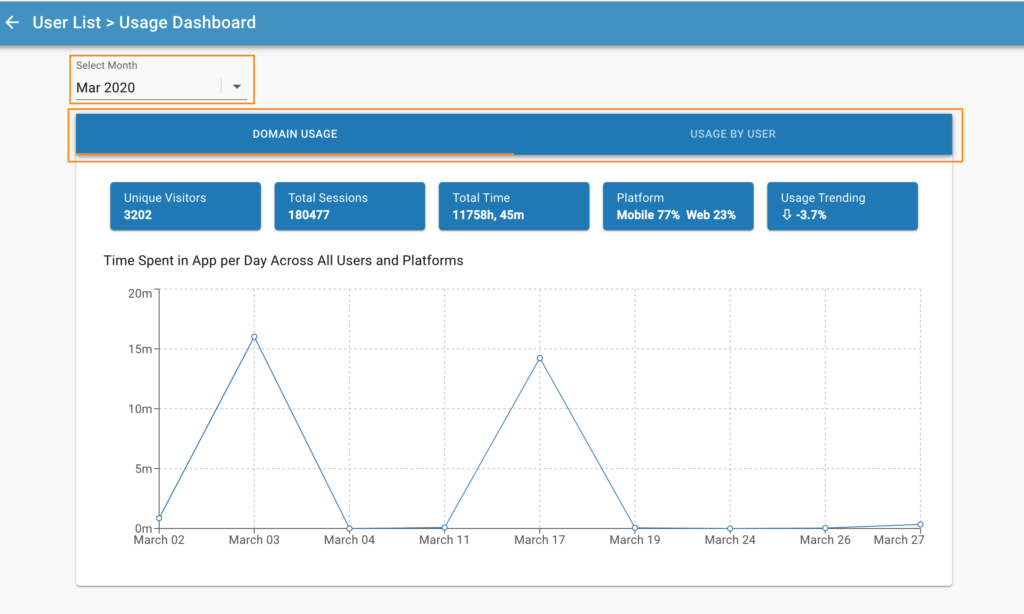
Use the “Select Month” option in the top left to specify which’s months data you would like to view. Select the tabs for Domain Usage and Usage by User as needed to switch between views.
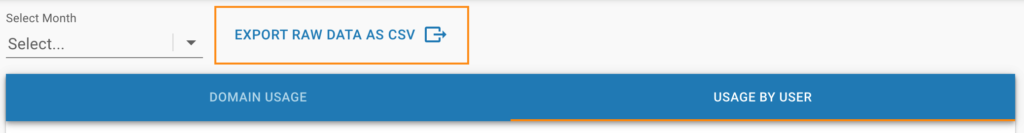
To export the Usage by Users data as a .CSV file, from the Usage by User tab select the option to Export Raw Data as CSV from the top left.
Domain Usage Overview
- Unique Visitors
- Total number of unique visitors accessing Envysion within your domain for the time period specified. Each individual user accessing Envysion is only counted once towards this value regardless of how many times they access the site or mobile app for within the time range.
- Total Sessions
- Total number of sessions to Envysion within your domain for the time period specified. A session is a user accessing Envysion and any interactions they have within the apps before signing out or having their session expire and reflects how often users are accessing Envysion.
- Total Time
- Total time in hours/minutes that users have spent in the Envysion apps for your domain in the time period specified.
- Platform
- Percent of sessions utilizing the mobile app versus the web app within your domain for the time period specified.
- Usage Trending
- A comparison of total usage between the selected month and prior month shown as a percent. A positive value shows more usage compared to the prior month and a negative value shows a decline in usage compared to the prior month.
- Time Spent in App Per Day Across All Users and Platforms
- Line graph representing the total time in hours/minutes that users have spent in the Envysion apps broken down by day.
Usage by User Overview
- User Name
- User name for user account.
- First Name
- First name associated to user account
- Last Name
- Last name associated to user account
- Role Name
- Role associated to user account. Represents what functionality of the app the user is allowed to access.
- Access List Name
- Access List associated to user account. Represents what sites within the domain the user is allowed to access.
- Last Session
- Last session by user to access Envysion within the specified timeframe.
- Days Active
- Total number of days within the specified timeframe that the user accessed Envysion.
- Total Session Count
- Total number of sessions by user to Envysion within the time period specified. A session is a user accessing Envysion and any interactions they have within the apps before signing out or having their session expire and reflects how often the user is accessing Envysion.
- Browser Session Count
- Number of session by the user through the Envysion web app.
- Mobile Session Count
- Number of session by the user through the Envysion mobile apps (iOS or Android).
- Total Session Duration (Minutes)
- How many minutes the user spent in the app within the timeframe.
- Average Session Duration (Minutes)
- Average amount of time user spent in Envysion per session within the timeframe.