Reports and Intelligence:
Reports Introduction
Envysion’s Reports 2.0 combines different sets of data with video playback to give insights into your restaurants and employees to help you detect employee training issues, suspicious activity, fraud, or metrics of value. Envysion offers a variety of customizable reports to target specific metrics and use cases. To get started, on the web app, click the “Intelligence” button from the menu (if you see multiple options available when clicking, select “Reports 2.0”).
Navigating Reports
Landing Page
Getting to your reports easily is important for you to quickly review those at-risk transactions and take any necessary actions. Your report landing page is broken down into three sections:
- Insights (Beta) – The section provides data analytics to help identify abnormalities and outliers in your point of sale data.
- My Reports – The reports you’ve built and have saved
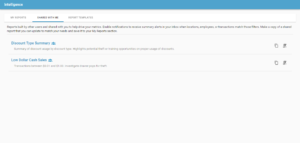
- Shared With Me – The reports others have built and shared with you
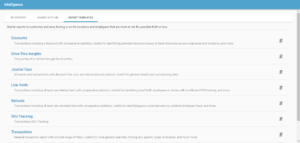
- Report Templates – Base reports for you to customize to surface at-risk transactions and events.
Reports users are delivered to the section based on what reports are available to them. Report builders who have saved their own will land on the My Reports view, Report users who do not own reports but have reports shared with them will arrive on the Shared with Me view, and users who have not built a report or had a report shared with them will arrive on the Report Templates page to get them started building reports.
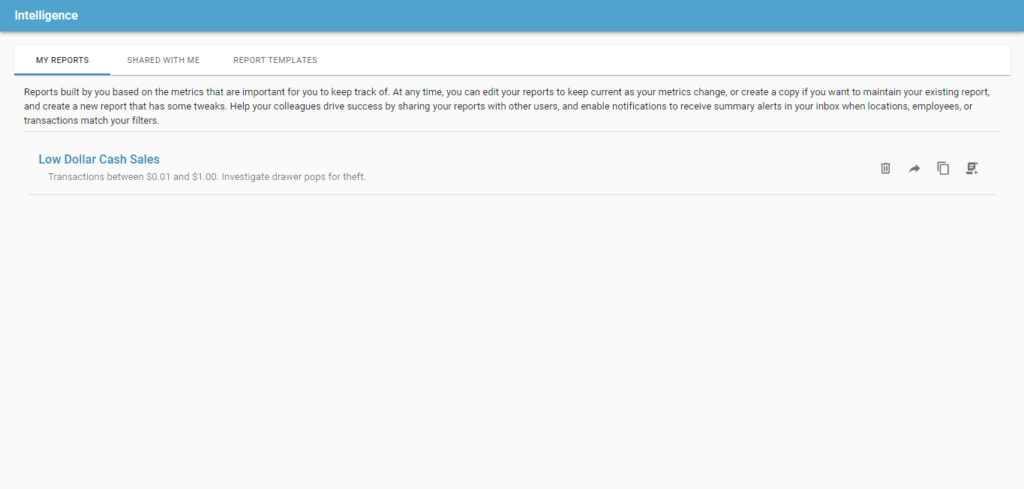
- To run any report, click the name of the report, or select the “Run Report (
 )” icon.
 - To create a new report based on another saved report select the “Duplicate Report (
 )” icon.
 - To share reports you’ve created, click the “Share Report (
 )” icon.
 - To delete a report you’ve created, click the “Delete Report (
 )” icon.
 - You can see the name of the person who shared a report with you by hovering over the “Shared by (
 )” icon.
Report Results
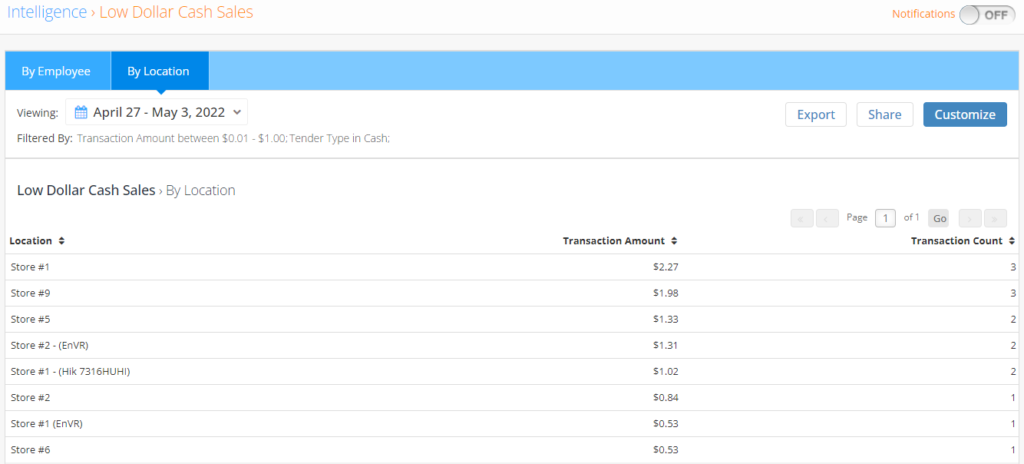
The results page starts off with a summary-level view of your data. The blue bar at the top of the screen contains different grouping options, which you can switch between at any time. Select a row to drill down further into your results. Depending on the report and view, you may go directly from a summary to a transaction level results page with video playback.
Some reports may offer additional groupings for the summary views, such as going from the Location view to a summary by Employees of that location, before going to the transaction level results so you can have a more precise set of results if you want to pinpoint a specific employee within challenging location.
Video Playback
Drilling down into a specific location, employee, etc, will return a list of transactions or events that you open and view your location’s video and data sid-by-side. For additional details, please visit the Reports Controls page which includes details on preserving video by Saving Clips or Creating Incidents.
![]()