Audit Services:
Operational Audit Dashboard
For domains with Operational Audits, the Dashboard in the Envysion web app displays the results of your audit projects and allows you to drill into the specific results of any audit performed.
Dashboard
- From the Envysion web app select Dashboards from the top right.
- For many domains with the Dashboard, this page will be the landing page when you load the app.
- If Dashboard is not your landing page and you would like it to be please contact your account’s customer service manager.
- For many domains with the Dashboard, this page will be the landing page when you load the app.
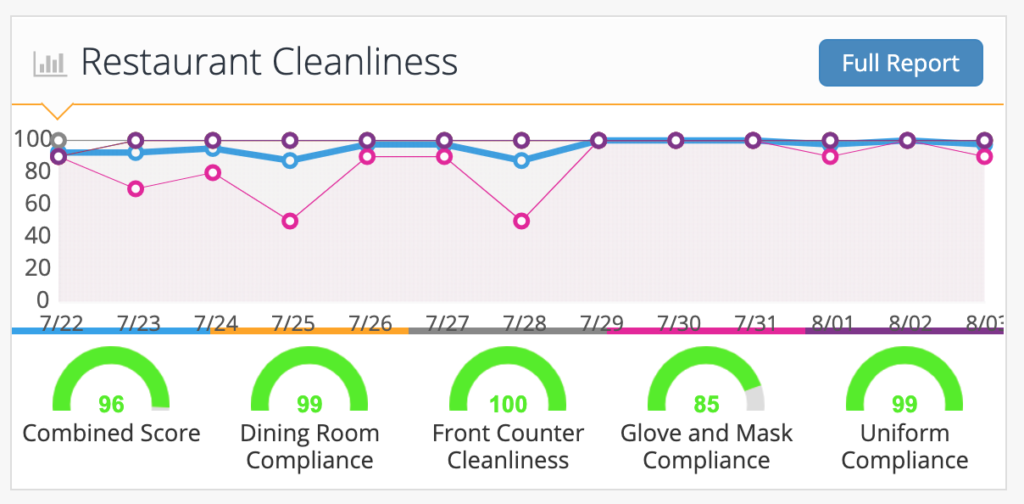
- A graph will show on the dashboard for each operational audit project running for your domain (ie if you have a project for Restaurant Cleanliness and Drive-Thru Engagements you would have two graphs on this screen).
- The graph shown will only reflect the results for sites that you have permission for according to your Access List.
- To see the detailed view for a project select anywhere on a graph or the Full Report button.
Detailed View
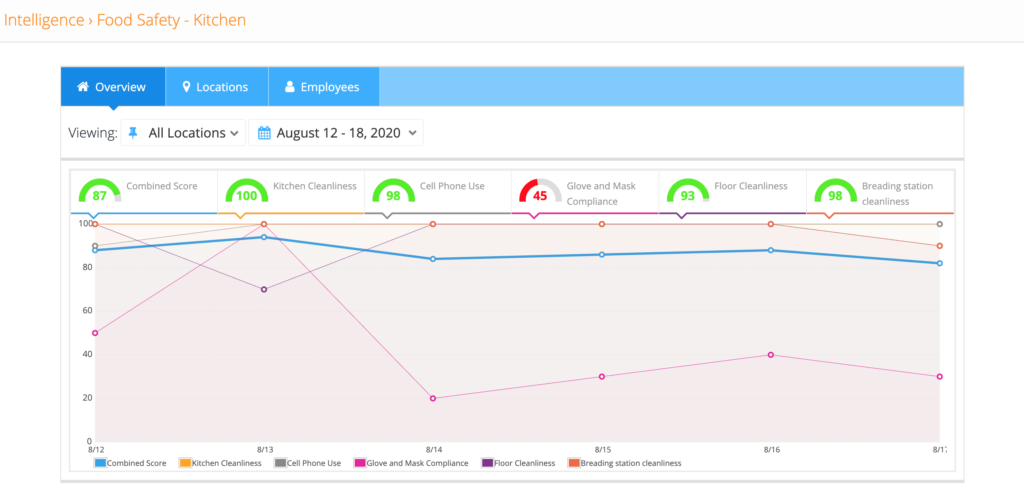
- By default the detailed view will show All Locations for the past week.
- Filter to show a single site by selecting the dropdown for All Locations and selecting a specific site.
- Change the date range displayed by selecting the dropdown for the date field and choosing from the options provided.
Overview tab
- This tab provides a more detailed view of the graphs for the project.
- The gauges at the top show the total score for a specific criteria from the time period displayed.
- The line graph displays how each criteria scored each day for the time period displayed.
- Hover over any point in the line graph to see the specific criteria, date, and score.
- The legend below the graph shows which color represents which project criteria.
- Select any gauge to remove that datapoint from the line graph to provide a focused view on specific metrics.
Locations
- This tab provides a view of project scores by location and provides the ability to drill into the audit results.
- The results table shows the combined score for a store and the score for the individual metrics.
- The table can be sorted by any column, select the desired header to change sorting.
- Select any row from the table to see the results for that location.
- The project gauges and graph show the results for the specific location.
- The Scored Samples section shows each sample that was reviewed with the project scores, date, and time of the audit.
- Select any Scored Sample to see the audit footage and any additional comments as to the score received.
Employees
- This tab is not used in conjunction with Operational Audits and will not contain any information.
Was this post helpful?
Let us know if you liked the post. That’s the only way we can improve.