Report Types:
Drive-Thru Insights Report
Description:
This report allows operators to analyze their drive-thru traffic to surface locations or hours of operation where potential issues have arisen that reduce the efficiency of the drive-thru operation overall. It also links vehicles with transactional data, allowing users to surface possible theft from cars without transactions in the drive-thru.
This report can also highlight locations or teams that are executing their goals and showing optimal drive-thru efficiency. Download the fact sheet here.
Views:
By Location / Hour:
This view helps operators explore their drive-thru bottlenecks by identifying outlier stores, and then drilling in more deeply to understand the hours during which they can improve.
- Operators can see a list of their locations and drill into a specific location summarized by hours of operation (00 – 23 for midnight to 11 PM).
- Operators can then drill down into that hour to see a list of vehicles in the drive-thru during that time.
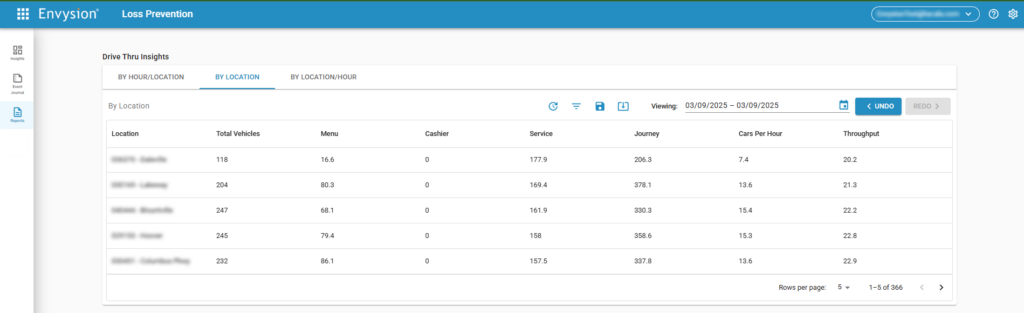
By Location:
This view helps operators investigate vehicles of interest by starting their investigation at the store level and drilling directly to vehicle journeys.
- Operators can see a list of their locations, and drill into a specific location to see a list of all vehicle traffic at that location.
By Hour / Location:
This view helps operators ensure their drive-thrus are operating as expected during meal rushes, then allowing a drill down into the stores that struggle most during those periods.
- Operators can see a list of the hours of operation their locations had traffic (00 – 23 for midnight to 11 PM), then drill into a specific hour to view a list of all locations with traffic during that hour.
- Operators can then drill down into a location to see a list of vehicles in the drive-thru during that time.
Fields:
- Location – The name of the location
- Hour – 24hr representation of the time the vehicle left the drive-thru.
- 00 representing midnight through 12:59:59 AM, and so on, with 23 representing 11 PM through 11:59:59 PM.
- Menu – The duration, in seconds, that the vehicle triggered the sensor(s) for the menu board.
- Cashier – The duration, in seconds, that the vehicle triggered the sensor(s) for the cashier/payment window.
- Note: this is for operators with a two-window drive-thru system, who are utilizing a sensor at this point. It will show 0 for sites with a combined payment/pickup window.
- Service – The duration, in seconds, that the vehicle triggered the sensor(s) for the pickup window.
- Journey – This is the total duration, in seconds, that it took a vehicle to proceed through the drive-thru.
- Cars Per Hour – The average number of vehicles that went through the drive-thru.
- Throughput – The theoretical maximum number of vehicles traveling through the drive-thru.
- This is based on the largest value in the Menu, Cashier, and Service fields.
- If all three fields are equal to each other, then traffic is flowing consistently.
- If any field is significantly above the others, then the traffic is bottlenecked at that point and should be investigated.
- Receipt – At the by vehicle level, displays the receipt number linked to a particular vehicle. If no value is displayed, this is a potential car without transaction that should be investigated for possible theft.
Filters:
- Cars Per Hour
- Cashier Duration [in seconds]
- Has Receipt
- Journey Duration [in seconds]
- Location
- Menu Duration [in seconds]
- Service Duration [in seconds]
- Throughput
- Time [in 24hr notation 00:00:00 is 12:00:00 AM and 23:59:59 is 11:59:59 PM]
Pro Tips:
- Use Journey Duration GREATER THAN 600 to filter for vehicles that took longer than 10 minutes to get through your drive-thru
- Use any Duration Filter for the Menu, Cashier, or Service to focus on vehicles that spent longer at a touchpoint than your goal/threshold
- Use Has Receipt to focus on those vehicles that were not tied to a POS transaction to look for potential theft or loss.
- Compare your Cars Per Hour against your Throughput.
- Low CPH and High Throughput means you’re running efficiently but had low traffic.
- High CPH and High Throughput means you’re running efficiently and have high volume.
- Low CPH and Low Throughput means there are some areas of improvement to unblock getting customers through the drive-thru and de-risking abandonment or dissatisfied guests.
Multi-camera Playback Support:
Reports support multiple camera views being played back simultaneously. To display more than one camera view in reports, update the camera mapping for any additional cameras to be mapped to Register 55.
Interested in surfacing your drive-thru data to identify and break up bottlenecking, or find those cars that are getting food without being rung into the POS. Reach out to your CSM to start the conversation today!